


A few decades ago, data analytics had one job to do: tell the story of a team or organization’s historical performance through its numbers. Today, with big data tech, ML and AI in its arsenal, the power of analytics has expanded beyond imagination. Analytics is revolutionizing everything from personalized healthcare to fighting climate change and helping farmers with their agricultural output.
Organizations have woken up to the monumental power of data and are putting it to work - but not to the same degree, and not to meet the same objectives. Analytics differs vastly from one business to the next, depending on the maturity of the organization and its data environment.
Today, let’s explore the various ways in which data analytics can be leveraged as a business evolves.
Four types of data analytics
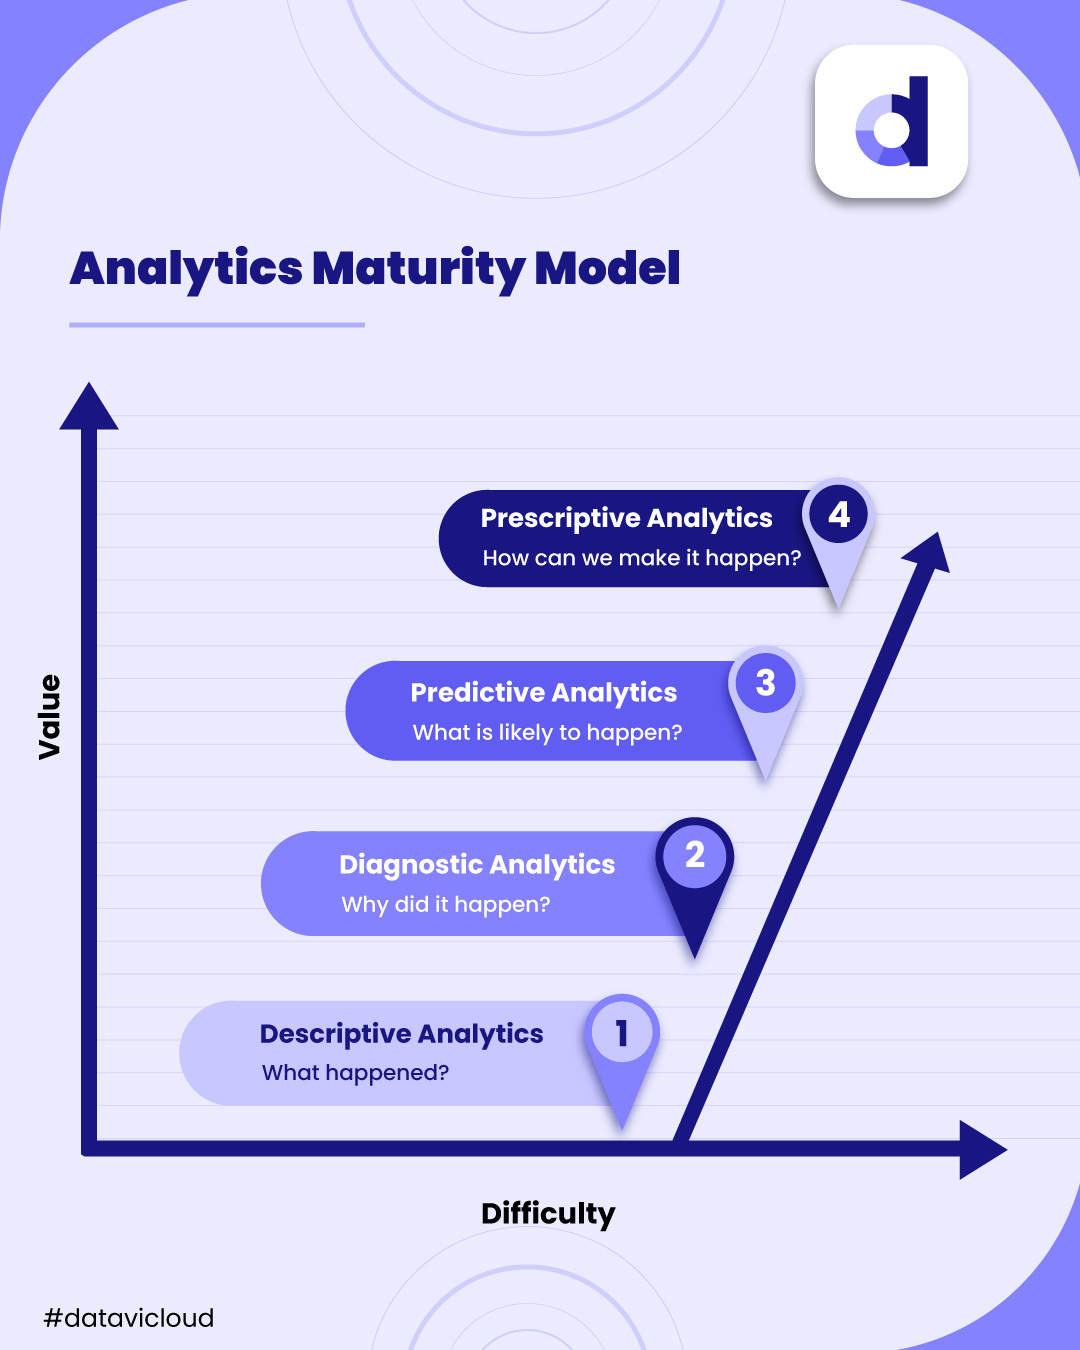
1. Descriptive Analytics: “What happened?”
The simplest form of analytics — descriptive — focuses on summarizing past data and providing insights into past events. By helping organizations understand their historical performance, it enables informed decision-making. A ubiquitous example is Google Analytics, the popular web tool that collects data about visits to your website, including their geographic location, device type, pages visited, and time spent on the site.
Another example is Netflix analyzing user viewing habits and preferences by tracking what users watch, when they watch it, and how long they stay on it. With this wealth of insights, Netflix makes data-driven decisions about new content creation and recommendations.
Startups and fledgling organizations start off with descriptive analytics soon after they make their first sale or launch their website. It is also the foundational rung of analytics — which is to say, unless you build core competencies in this area, you cannot really move upwards to more complex analytics.
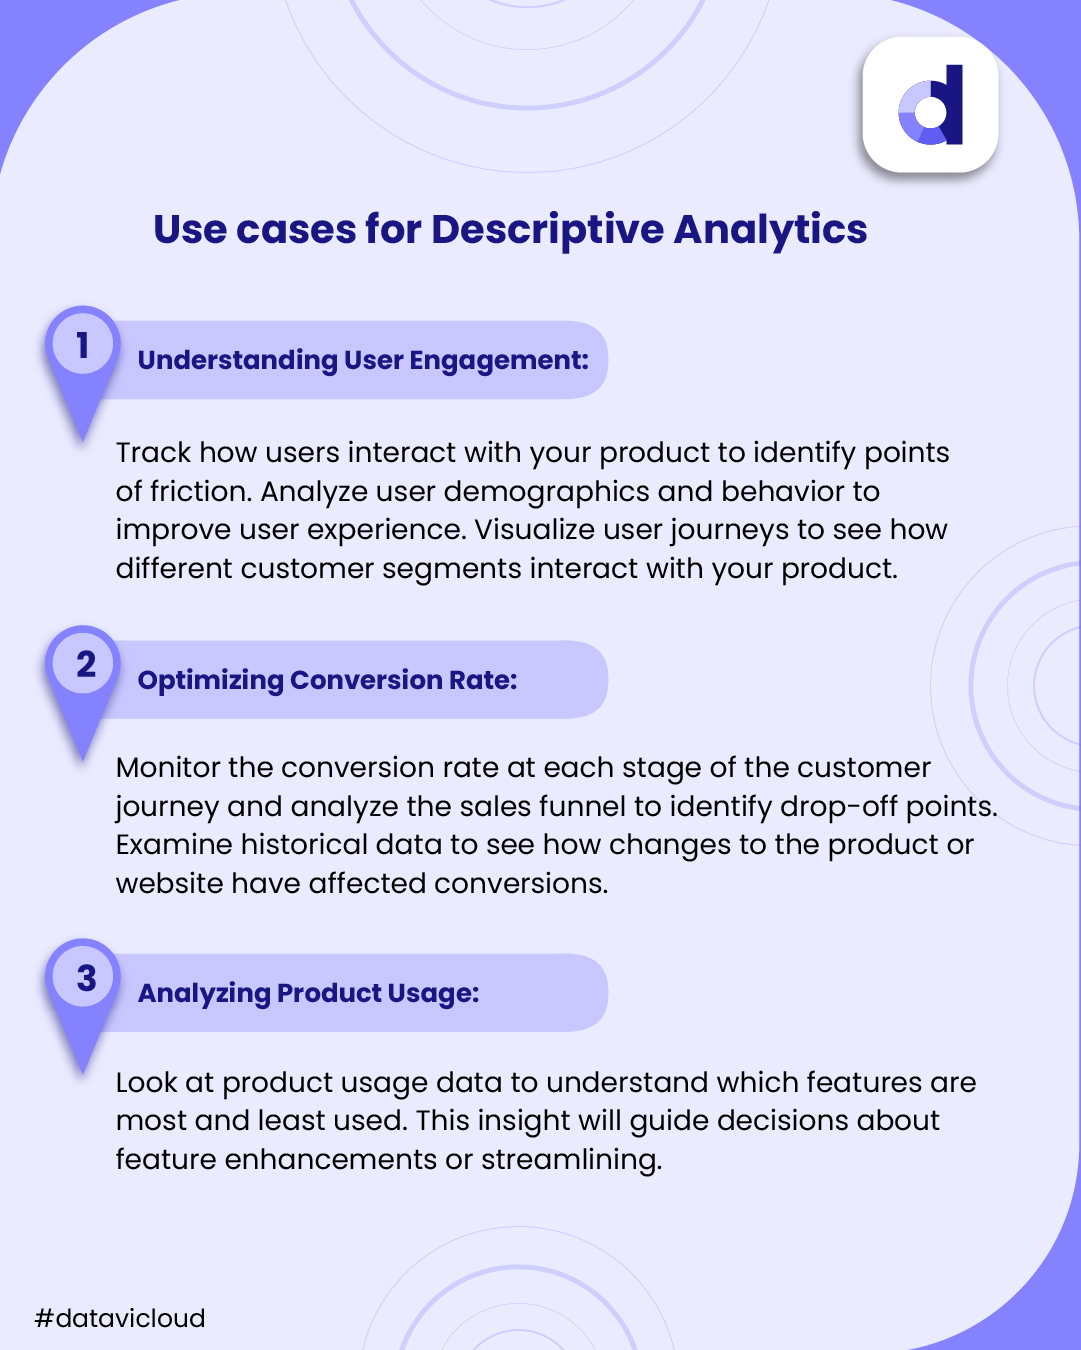
Here are some of the ways in which you can put descriptive analytics to use for your digital product.
A. Understand User Engagement: Track how users interact with your product, to identify which features are most and least used. Analyze user demographics and behavior to improve user experience, and visualize user journeys to understand how different customer segments are interacting with your product.
B. Optimize Conversion Rate: Monitor the conversion rate at each stage of the customer journey and analyze the sales funnel to identify drop-off points. Examine historical data to understand how changes to the product or website affect conversions.
C. Analyze Product Usage: Dive into product usage data to understand which features are underutilized or causing frustration among users - and with this insight, make informed decisions about feature enhancements or streamlining.
Descriptive analytics is a solid start; however, it only scratches the surface. It doesn’t try to establish cause-and-effect relationships. Despite its limitations, descriptive analytics is where many businesses stagnate in the analytics maturity model - a pity, since examining root causes can make your insights so much richer.
Which brings us to the next application type.
2. Diagnostic Analytics: “Why did it happen?”
Diagnostic analytics uses historical data too. But rather than “the what”, it looks at why an event happened. It helps you identify underlying causes, root problems, or unusual occurrences within your datasets.
A classic example from the banking sector: JP Morgan & Chase has been using the power of diagnostic analytics to detect fraud. They analyze transaction data to identify unusual patterns and potential fraudulent activities, protecting their customers from financial fraud.
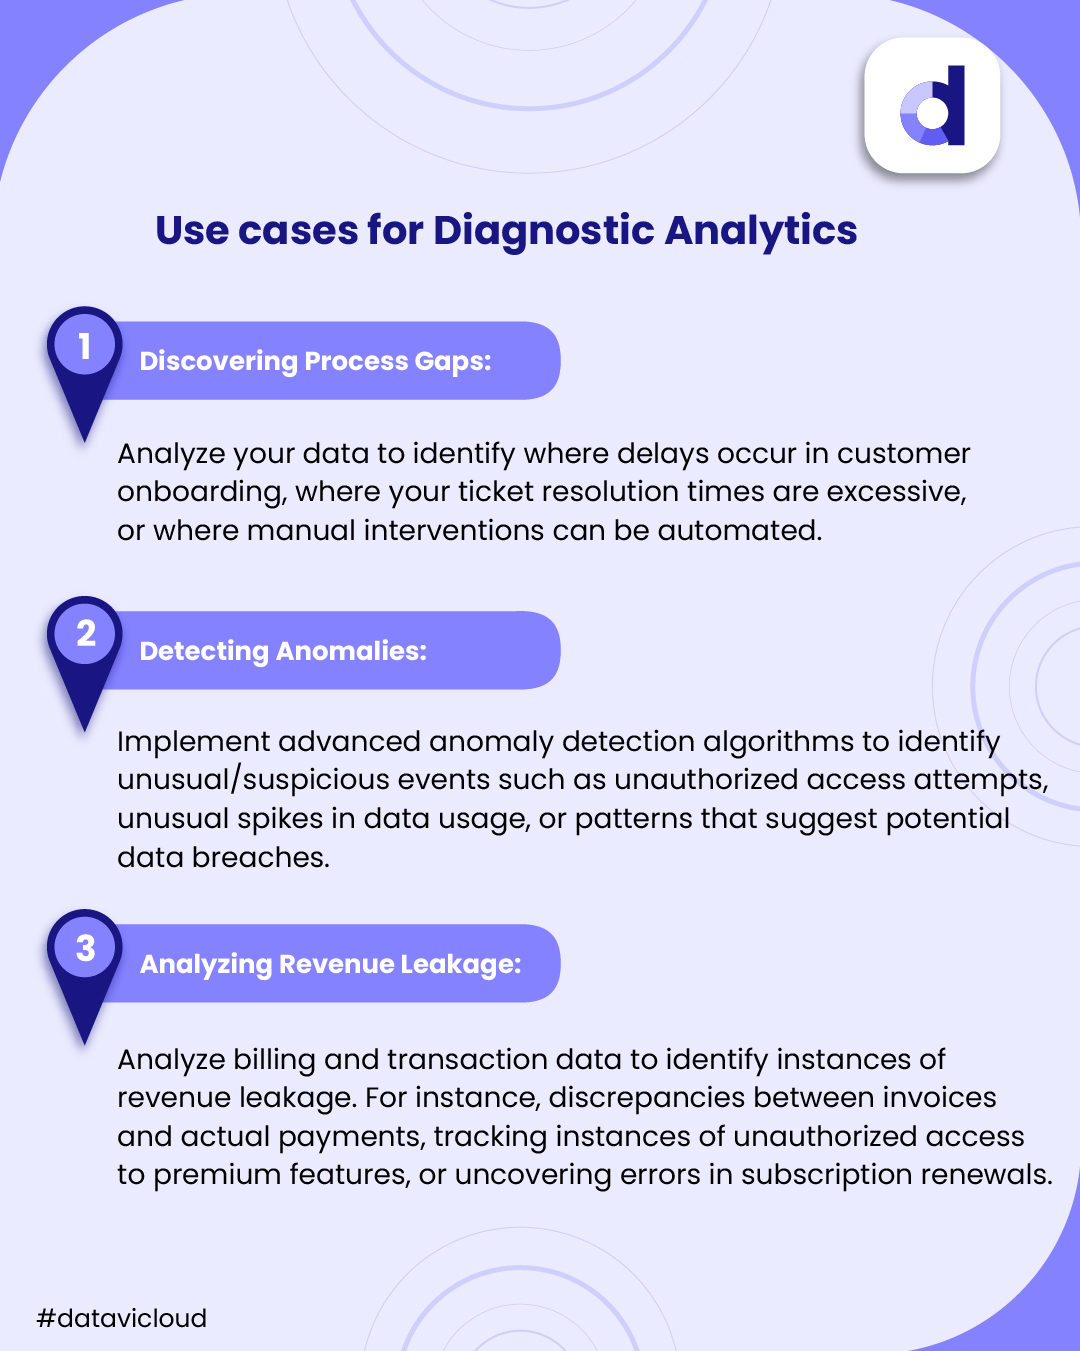
Here are some more use cases of diagnostic analytics, especially for SaaS businesses.
A. Discover Process Gaps: You can use diagnostic analytics to uncover operational inefficiencies and process gaps. For example, analyze your data to identify where delays occur in customer onboarding, where your ticket resolution times are excessive, or where manual interventions can be automated.
B. Detect Anomalies in Usage Patterns: You can implement advanced anomaly detection algorithms to identify unusual/suspicious events such as unauthorized access attempts, unusual spikes in data usage, or patterns that suggest potential data breaches.
C. Analyze Revenue Leakage: You can analyze billing and transaction data to identify instances of revenue leakage. This can include identifying discrepancies between invoices and actual payments, tracking instances of unauthorized access to premium features, or uncovering errors in subscription renewals.
Diagnostic analytics happens to be the most overlooked stage of the analytics maturity model. Too many data teams tend to go from ‘what happened’ to ‘what will happen next’ without addressing the all-important why of it.
3. Predictive Analytics: “What is likely to happen?”
Now, to the more futuristic stuff! Predictive analytics uses historical data and statistical algorithms — the bulk of it derived from descriptive and diagnostic analytics — to make estimates about outcomes.
At this stage of data maturity, analytics can play oracle, forecasting future trends, identifying potential opportunities, and mitigating risks.
A real-life example would be Amazon employing predictive analytics to forecast customer demand for various products. With historical sales data, seasonality patterns, and customer behavior as inputs, predictive analytics helps Amazon optimize its inventory management, ensuring that popular products are in stock and reducing the risk of overstocking or stockouts.
Here are just a few things you can implement for your SaaS business with predictive analytics.
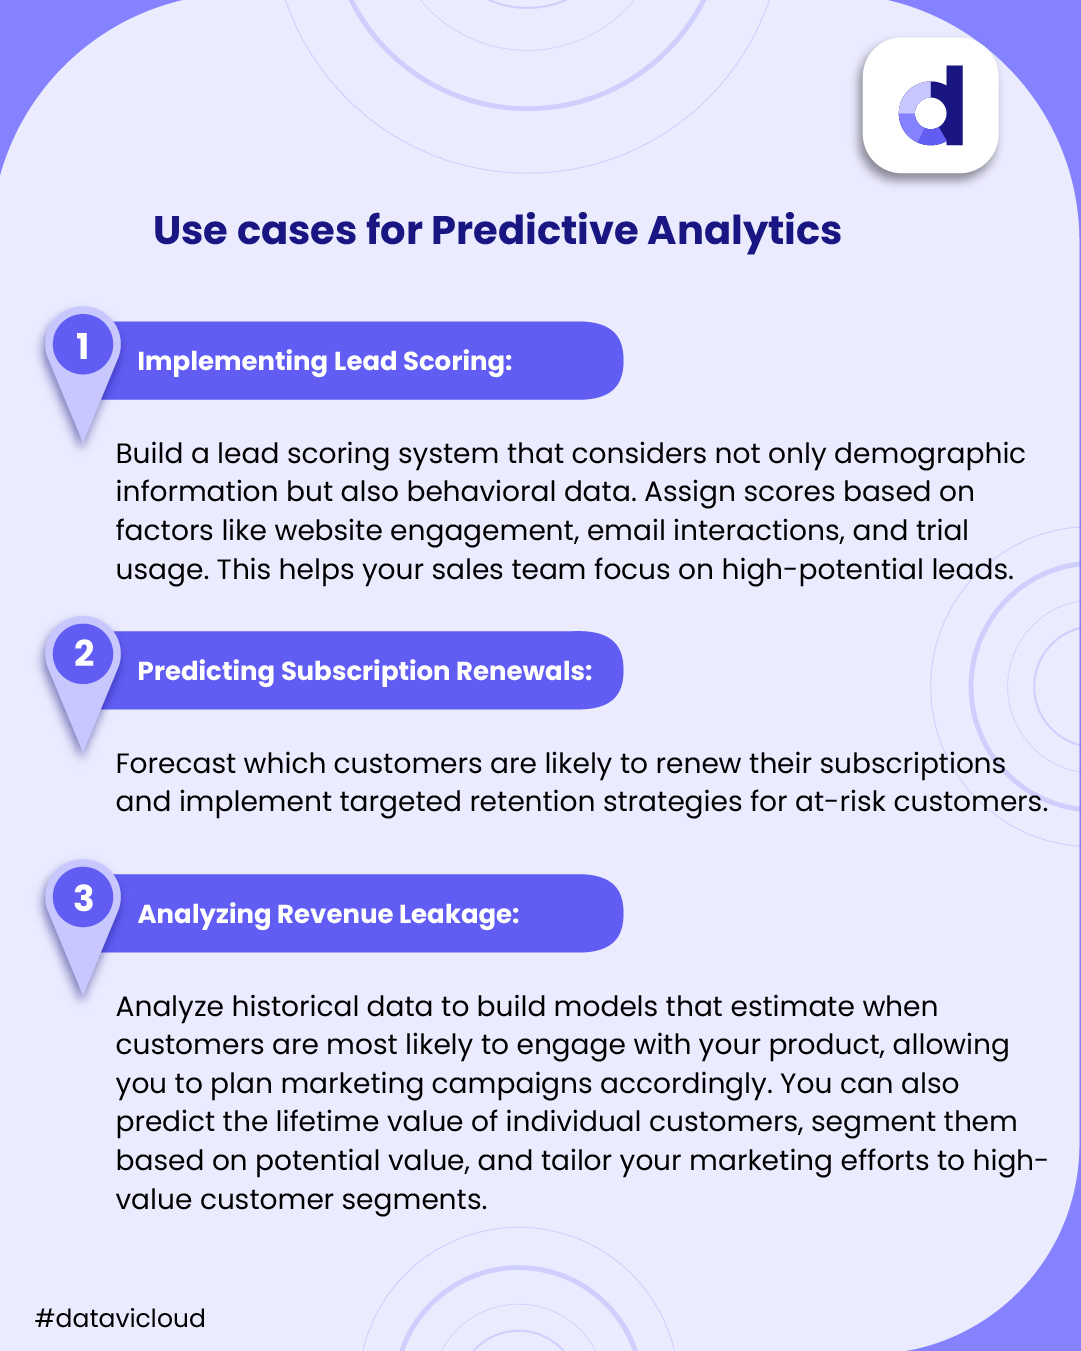
A. Implement Lead Scoring: Build a lead scoring system that considers not only demographic information but also behavioral data. Predictive analytics can assign scores based on factors like website engagement, email interactions, and trial usage. Armed with these scores, your sales team can focus on leads with the highest likelihood of conversion.
B. Predict Subscription Renewals: You can forecast which customers are likely to renew their subscriptions and implement targeted retention strategies for at-risk customers.
C. Predict Customer Engagement and Lifetime Value: You can build predictive models that forecast customer engagement by analyzing historical data. These models can estimate when customers are most likely to engage with your product, allowing you to plan marketing campaigns accordingly. You can also predict the lifetime value of individual customers, segment them based on their potential value, and tailor your marketing efforts to high-value customer segments.
While modeling is the star of predictive analytics, it wouldn’t work without high-quality data. This is why organizations with a rock-solid foundation in descriptive and diagnostic analytics are better equipped to handle predictive analytics.
Predictive analytics is the gateway to the next step —prescriptive analytics.
4. Prescriptive Analytics: “How do we make it happen?”
At the apex of the maturity model is prescriptive analytics. This goes beyond predicting outcomes to tell you what to do to achieve desirable results. Its primary work is to take the educated guesswork out of data analytics.
Let’s look at prescriptive analytics in action. Say Walmart wants to optimize its supply chain to prepare for the holiday season.
First, it gathers vast amounts of data from sources within its supply chain, including transactions, supplier information, logistics data, weather patterns etc. Next, using advanced predictive analytics models, it forecasts demand for each product in its inventory, taking into account sales trends during the holidays, promotions etc.
Now, prescriptive analytics comes into play, recommending optimal inventory levels for each product. The system not only considers anticipated demand but also factors in supply chain constraints, such as lead times, transportation capacities, and storage limitations.
The outcome? A more responsive, adaptive, and holiday-ready supply chain.
Here’s some of what prescriptive analytics can help you achieve.
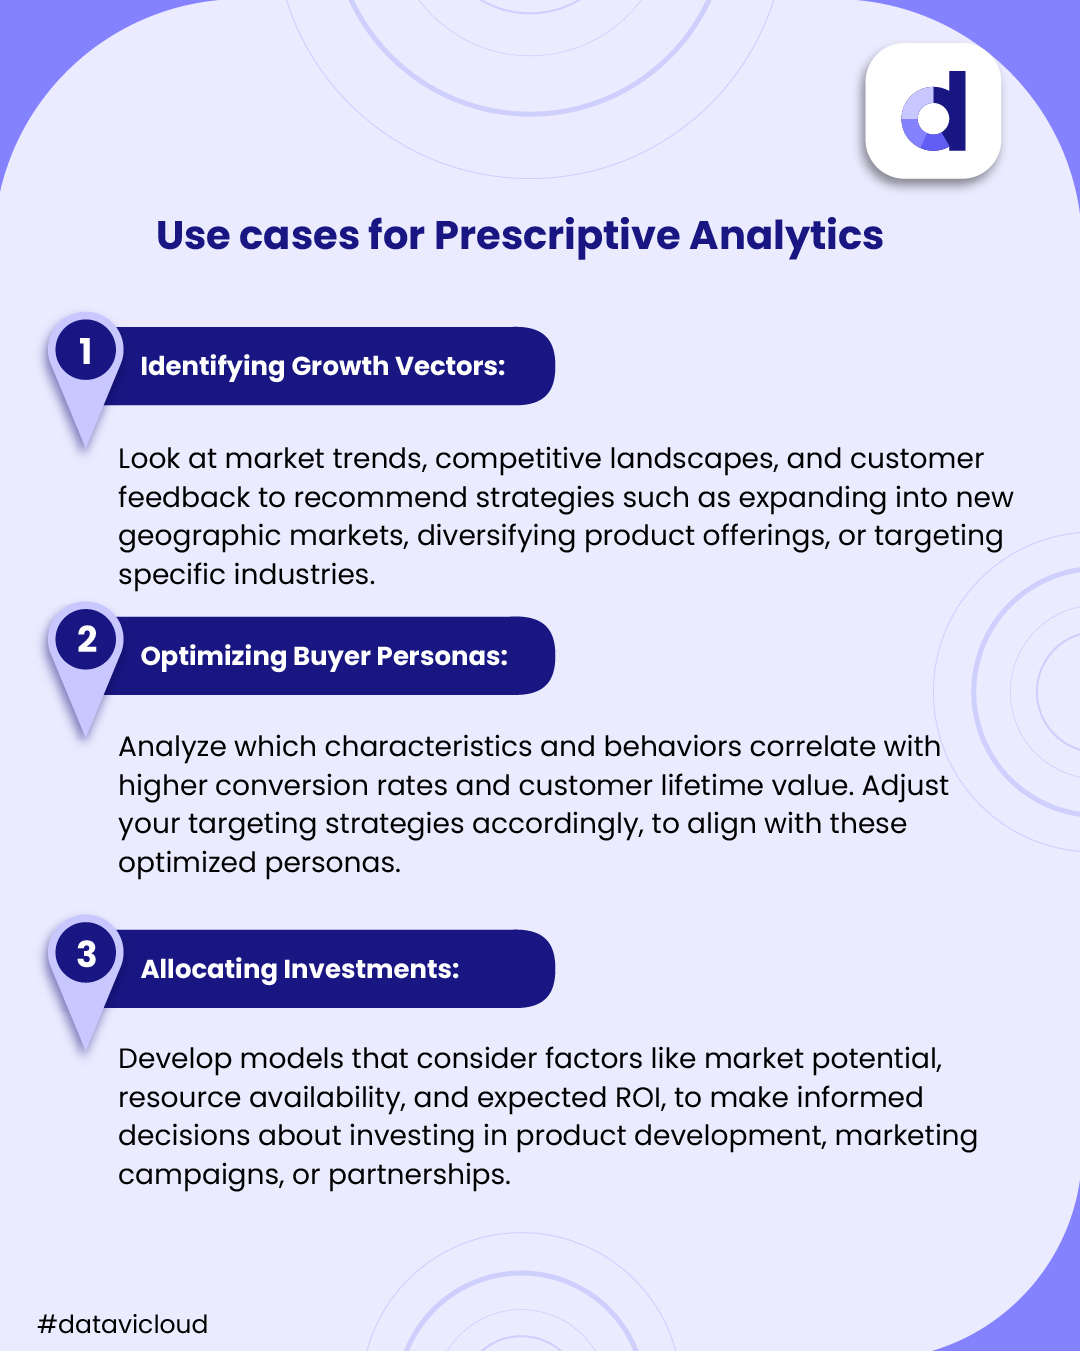
A. Identify Growth Vectors: Your analytics engine could look at market trends, competitive landscapes, and customer feedback to recommend specific strategies - such as expanding into new geographic markets, diversifying product offerings, or targeting specific industries.
B. Optimize Buyer Personas: Set your prescriptive system to analyze which characteristics and behaviors correlate with higher conversion rates and customer lifetime value. Adjust your targeting strategies accordingly, to align with these optimized personas.
C. Allocate Investments: Prescriptive analytics can develop models that consider factors like market potential, resource availability, and expected ROI, to help you make informed decisions about investing in product development, marketing campaigns, or partnerships.
The Analytics Mix: Finding your balance
Many organizations tend to assume that the analytics maturity model is an upwards progression. As they grow, they tend to defocus from descriptive/diagnostic analytics and over-invest in the ‘higher’ forms of analytics - prescriptive and predictive.
This is a mistake, because you need clean, organized data from descriptive analytics, in order to ensure the smooth working of the upper rungs. In fact, each level of analytics is a stepping stone to the next - descriptive to diagnostic, diagnostic to predictive, and predictive to prescriptive.
While prescriptive and predictive analytics are indeed valuable, they shouldn’t come at the expense of basic analytics. Ideally, all types of data analysis should be used in tandem to get as full a picture as possible of your business.
Where does your organization stand in the data maturity model? What steps are you implementing to take your data journey forward?


